BUAL 2650 Chen Yan Q&A Latest Update
Course:
BUAL2650
Institution:
BUAL2650
BUAL 2650 Chen Yan Q&A Latest Update
After purchase, you get:
✅ Instant PDF Download
✅ Verified answer explanations
✅ Refund if not Satisfied
✅ Prepared for 2025/2026 test cycle
Document Information
| Uploaded on: | May 8, 2025 |
| Last updated: | May 8, 2025 |
| Number of pages: | 10 |
| Written in: | 2025/2026 |
| Type: | Exam (elaborations) |
| Contains: | Questions & Answers |
| Tags: | BUAL 2650 Chen Yan Q&A Latest Update |
Seller Information

AdelineJean
User Reviews (0)
Exam (Elaborations)
$9.00
Bundle Deal! Get all 11 docs for just $20.00
Add to Cart
100% satisfaction guarantee
Refund Upon dissatisfaction
Immediately available after purchase
Available in Both online and PDF
$9.00
| 0 sold
Related Documents
Available in a Bundle
Content Preview
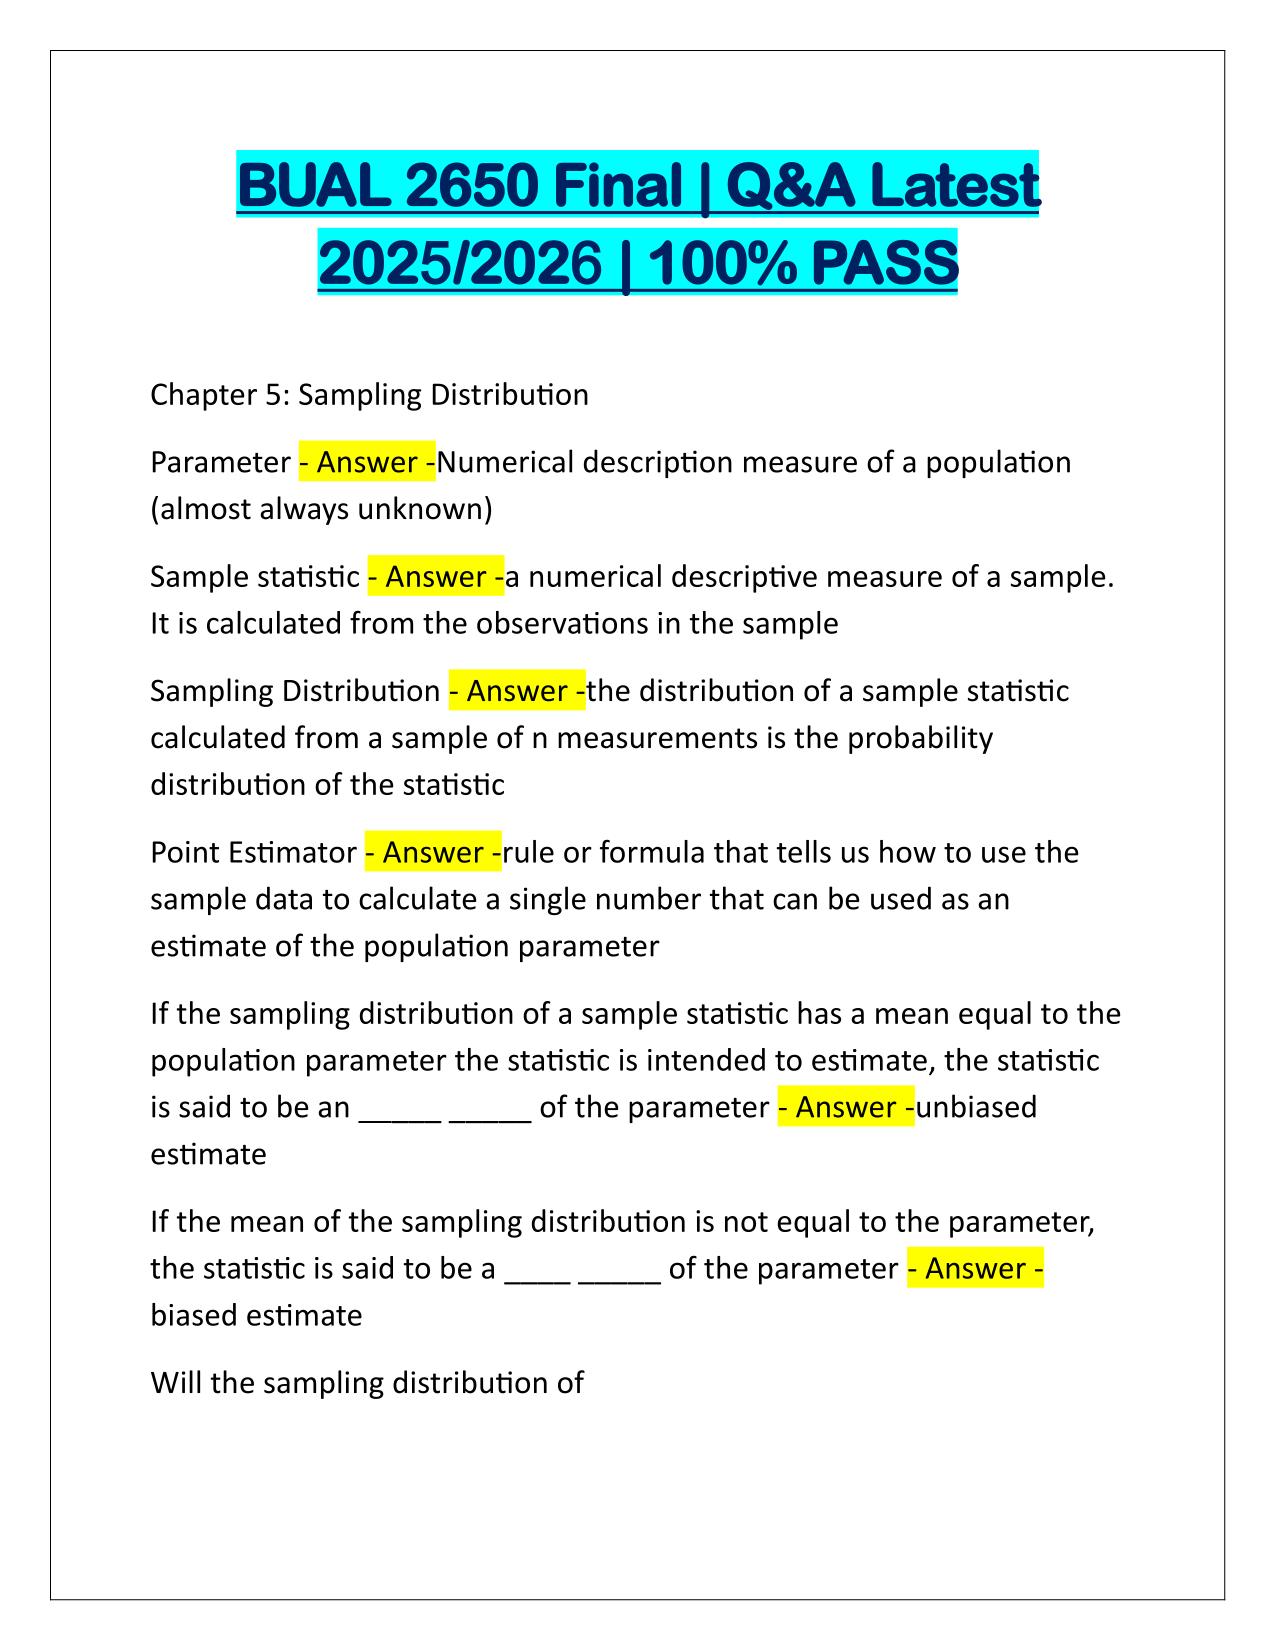
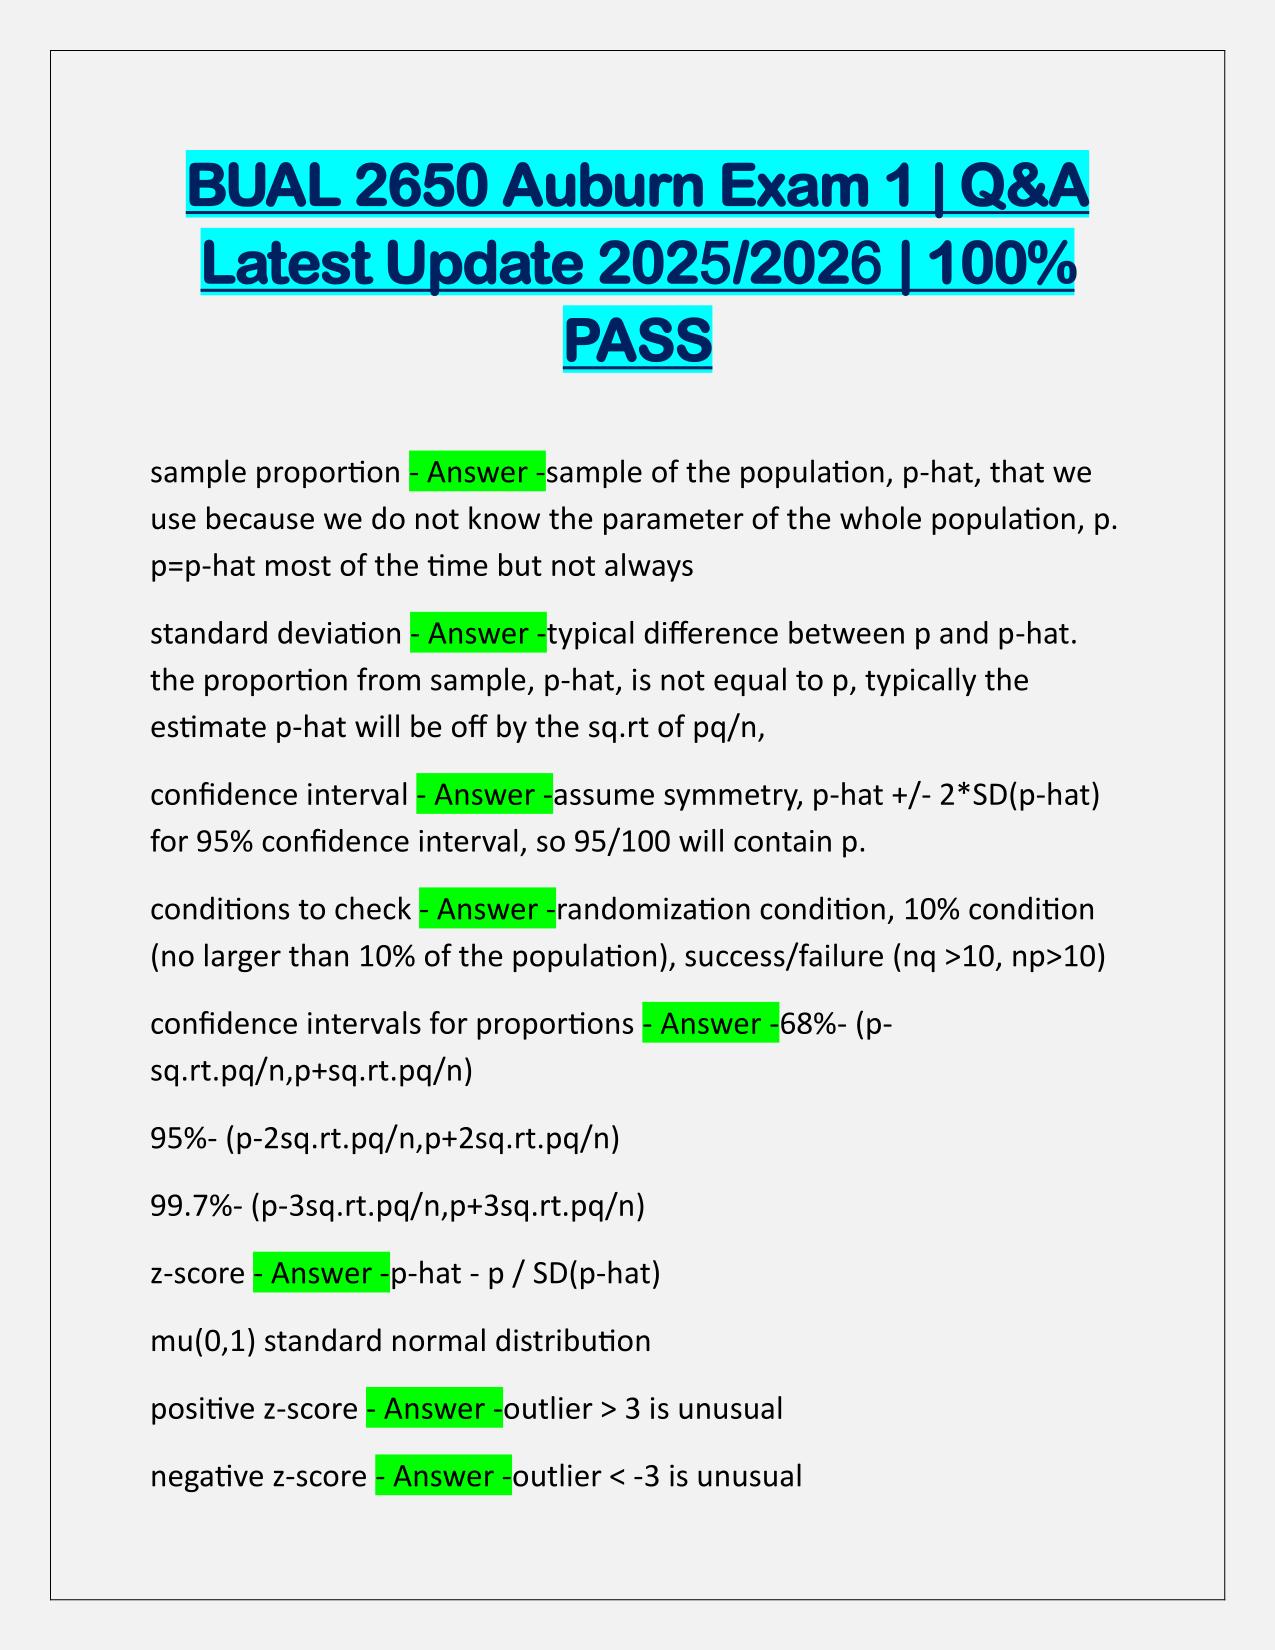
BUAL 2650 Chen Yan | Q&A Latest 2025/2026 | 100% PASS Business Analyst - Answer -Person who manages, cleans, and aggregates data; serves as a bridge between stakeholders and business by conducting analytical studies to help change business processes Business User - Answer -person who takes data to make decisions based on their jobs and also interprets data Data Scientist - Answer -a person skilled in data inference, algorithm development and technology in order to solve complex problems. Scatter Plot (what relationship does this image show) - Answer -The relation between %Fat and BMI is positive because it is going up. It is weaker towards the higher on the curve however very strong near the bottom of the curve around point (20,20) This scatter plot shows the relationship between an iPhone app's price and the quantity sold at different prices in thousands. A line of best fit is given. Question: What's the relationship between app's price and quantity sold? - Answer -This graph shows a negative, strong relationship between Apple App's price and Quantity Sold. Interpret a correlation coefficient of -0.96 (R) - Answer -The correlation coefficient is the distance away from the points on the graph. Or the
