BUAL 2650 Exam 1 Correctly Answered Latest Update
Course:
BUAL2650
Institution:
BUAL2650
BUAL 2650 Exam 1 Correctly Answered Latest Update
After purchase, you get:
✅ Instant PDF Download
✅ Verified answer explanations
✅ Refund if not Satisfied
✅ Prepared for 2025/2026 test cycle
Document Information
| Uploaded on: | May 8, 2025 |
| Last updated: | May 8, 2025 |
| Number of pages: | 17 |
| Written in: | 2025/2026 |
| Type: | Exam (elaborations) |
| Contains: | Questions & Answers |
| Tags: | BUAL 2650 Exam 1 Correctly Answered Latest Update |
Seller Information

AdelineJean
User Reviews (0)
Exam (Elaborations)
$9.00
Bundle Deal! Get all 11 docs for just $20.00
Add to Cart
100% satisfaction guarantee
Refund Upon dissatisfaction
Immediately available after purchase
Available in Both online and PDF
$9.00
| 0 sold
Related Documents
BUAL 2650 Final EXAM Q&A Latest Update
★ | $9.00
Available in a Bundle
Content Preview
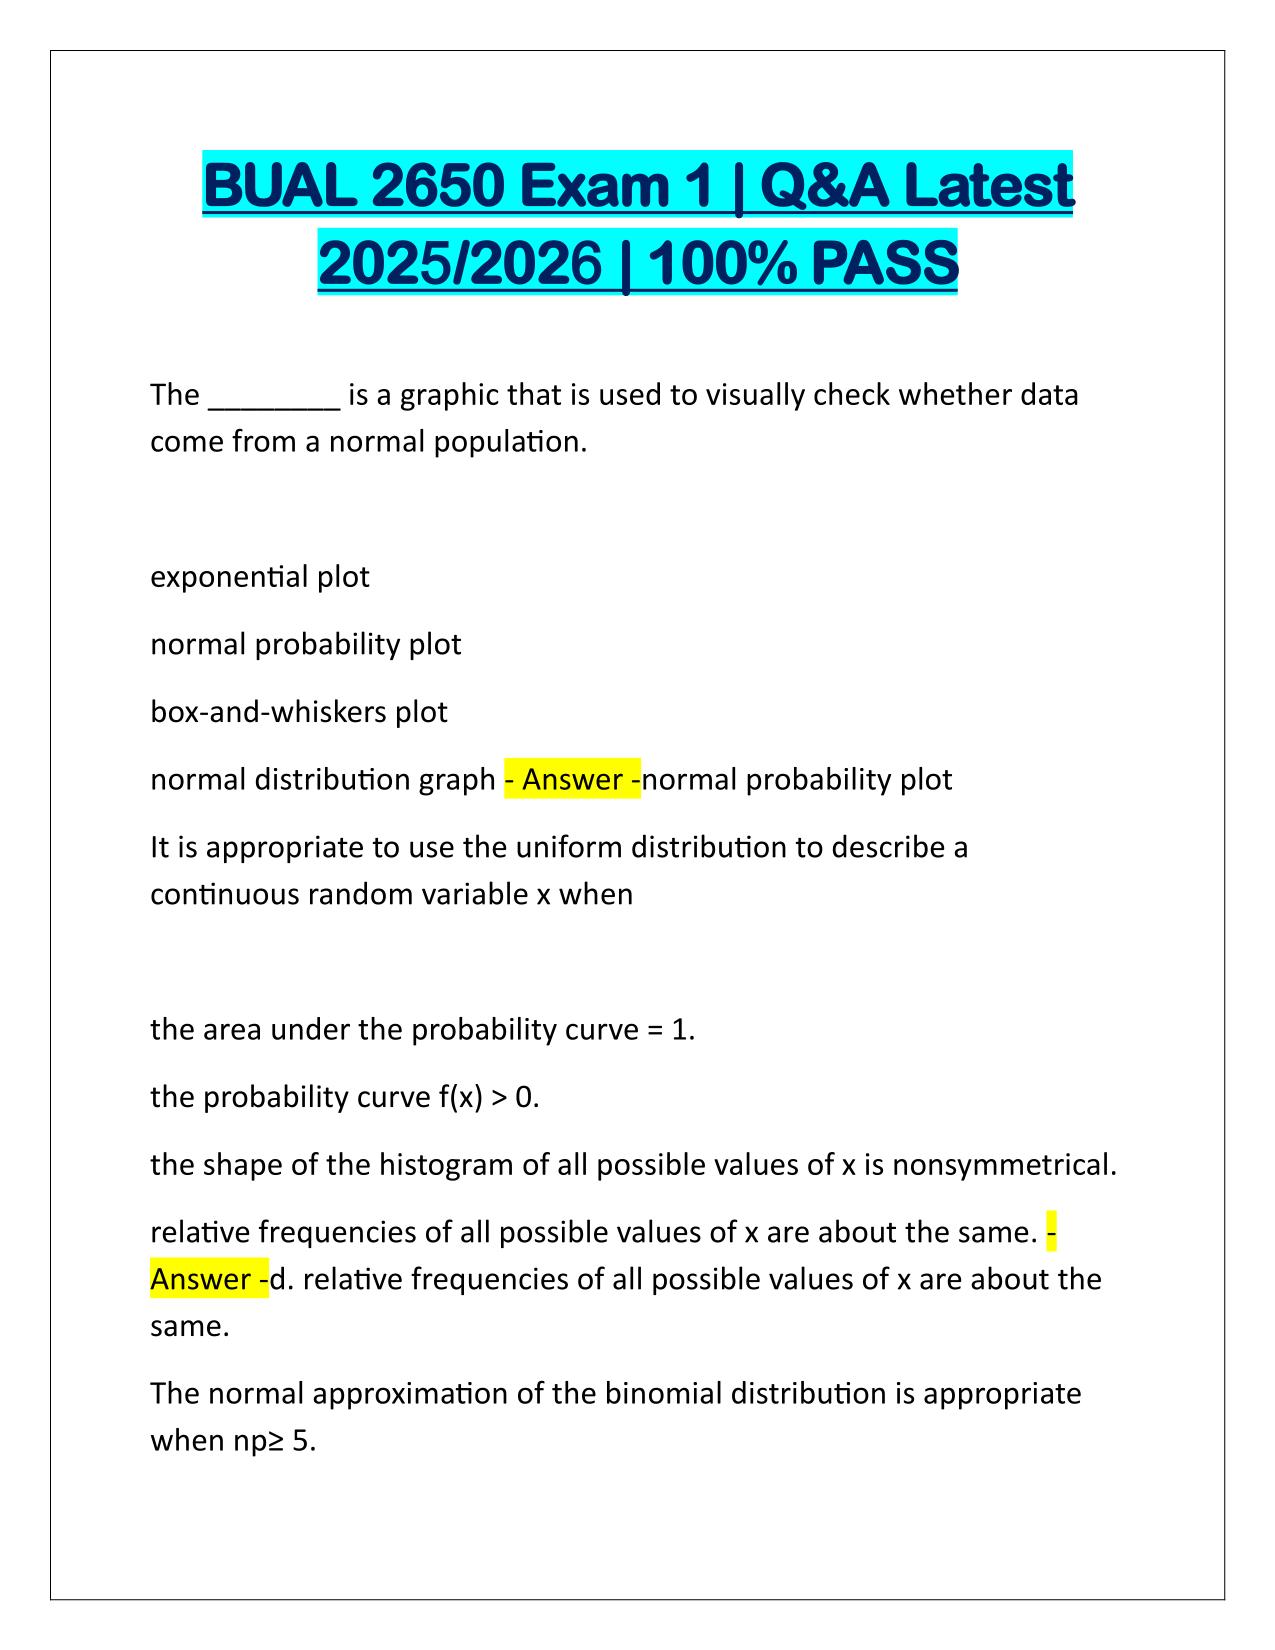
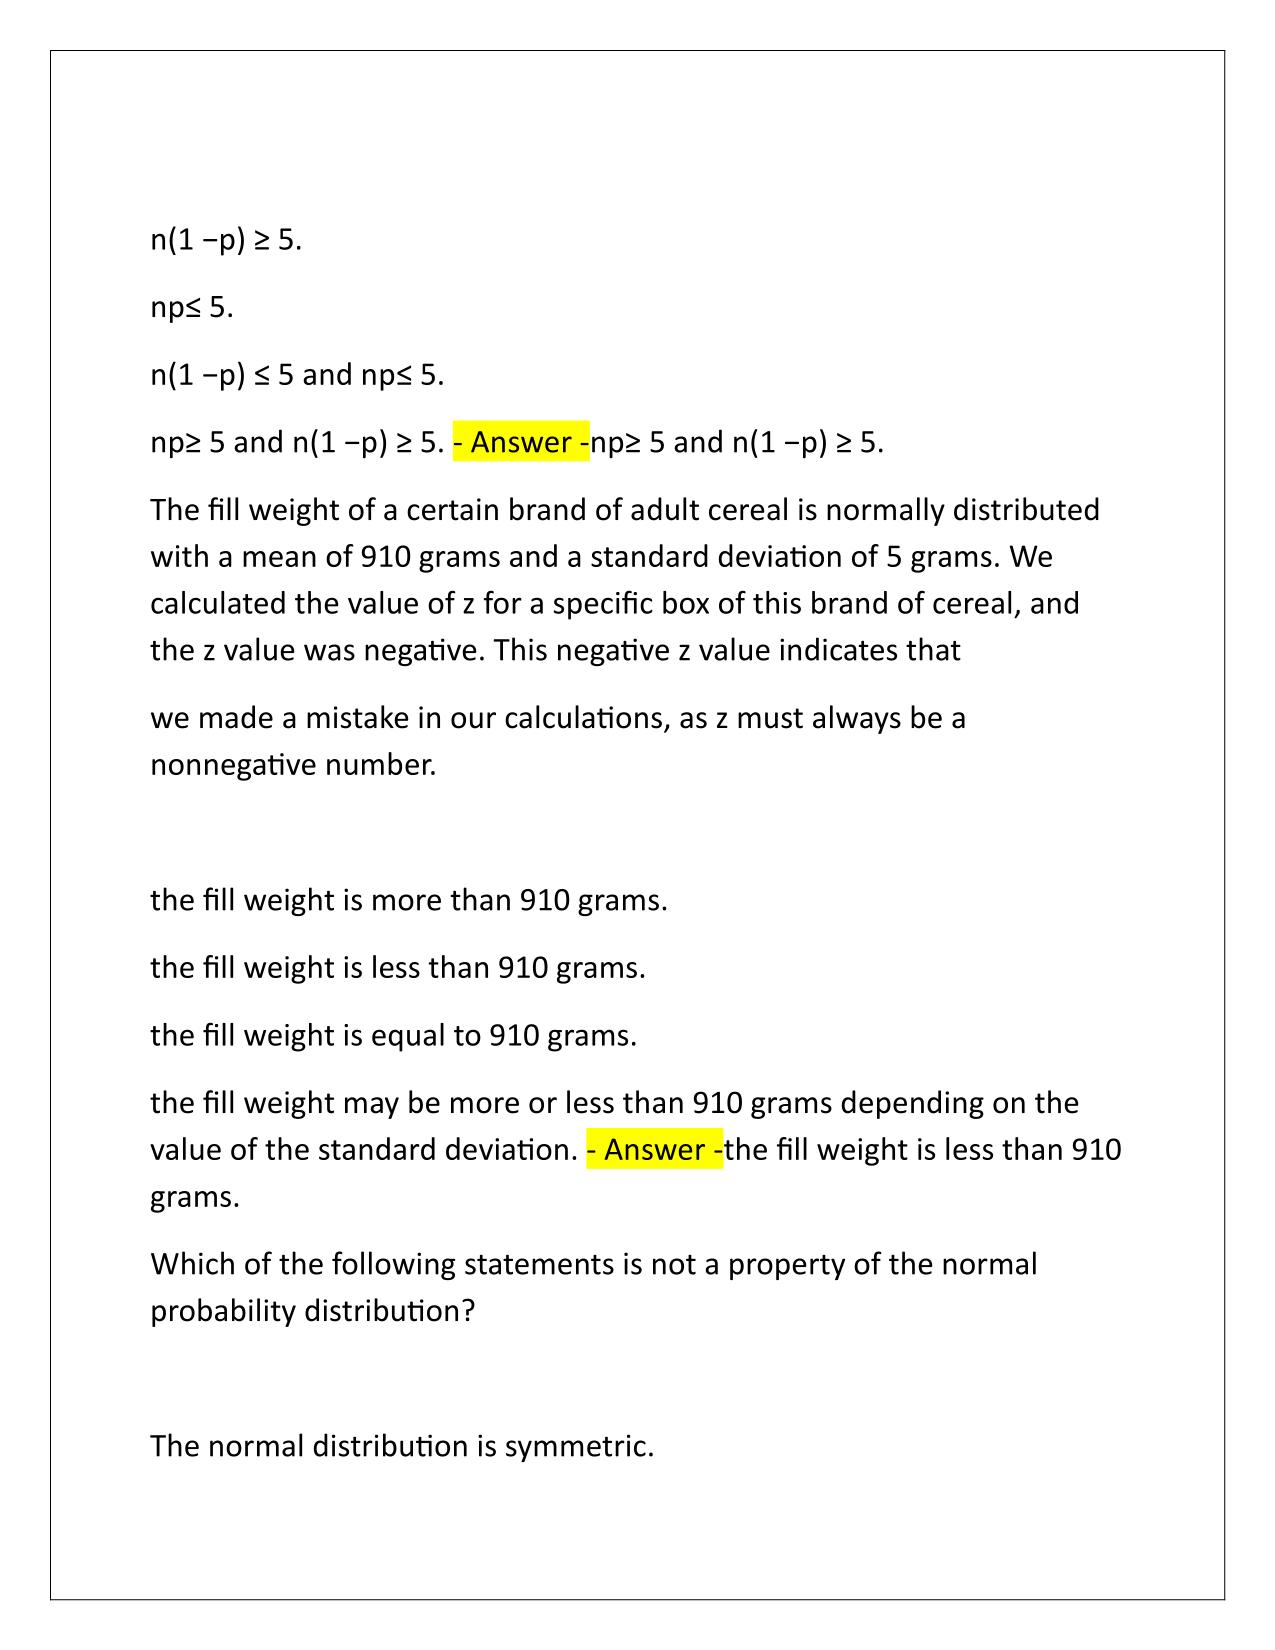
BUAL 2650 Exam 1 | Q&A Latest 2025/2026 | 100% PASS The ________ is a graphic that is used to visually check whether data come from a normal population. exponential plot normal probability plot box-and-whiskers plot normal distribution graph - Answer -normal probability plot It is appropriate to use the uniform distribution to describe a continuous random variable x when the area under the probability curve = 1. the probability curve f(x) > 0. the shape of the histogram of all possible values of x is nonsymmetrical. relative frequencies of all possible values of x are about the same. Answer -d. relative frequencies of all possible values of x are about the same. The normal approximation of the binomial distribution is appropriate when np≥ 5.
Gradesity

We are here to help
Questions? Leave a message!
Newsletter
Get notified upon new uploads. Subscribe to our Newsletter.