UCF QMB3200 MIDTERM STUDY ACTUAL 2025/2026 WITH VERIFIED SOLUTIONS
Course:
UCF QMB 3200
Institution:
UCF QMB 3200
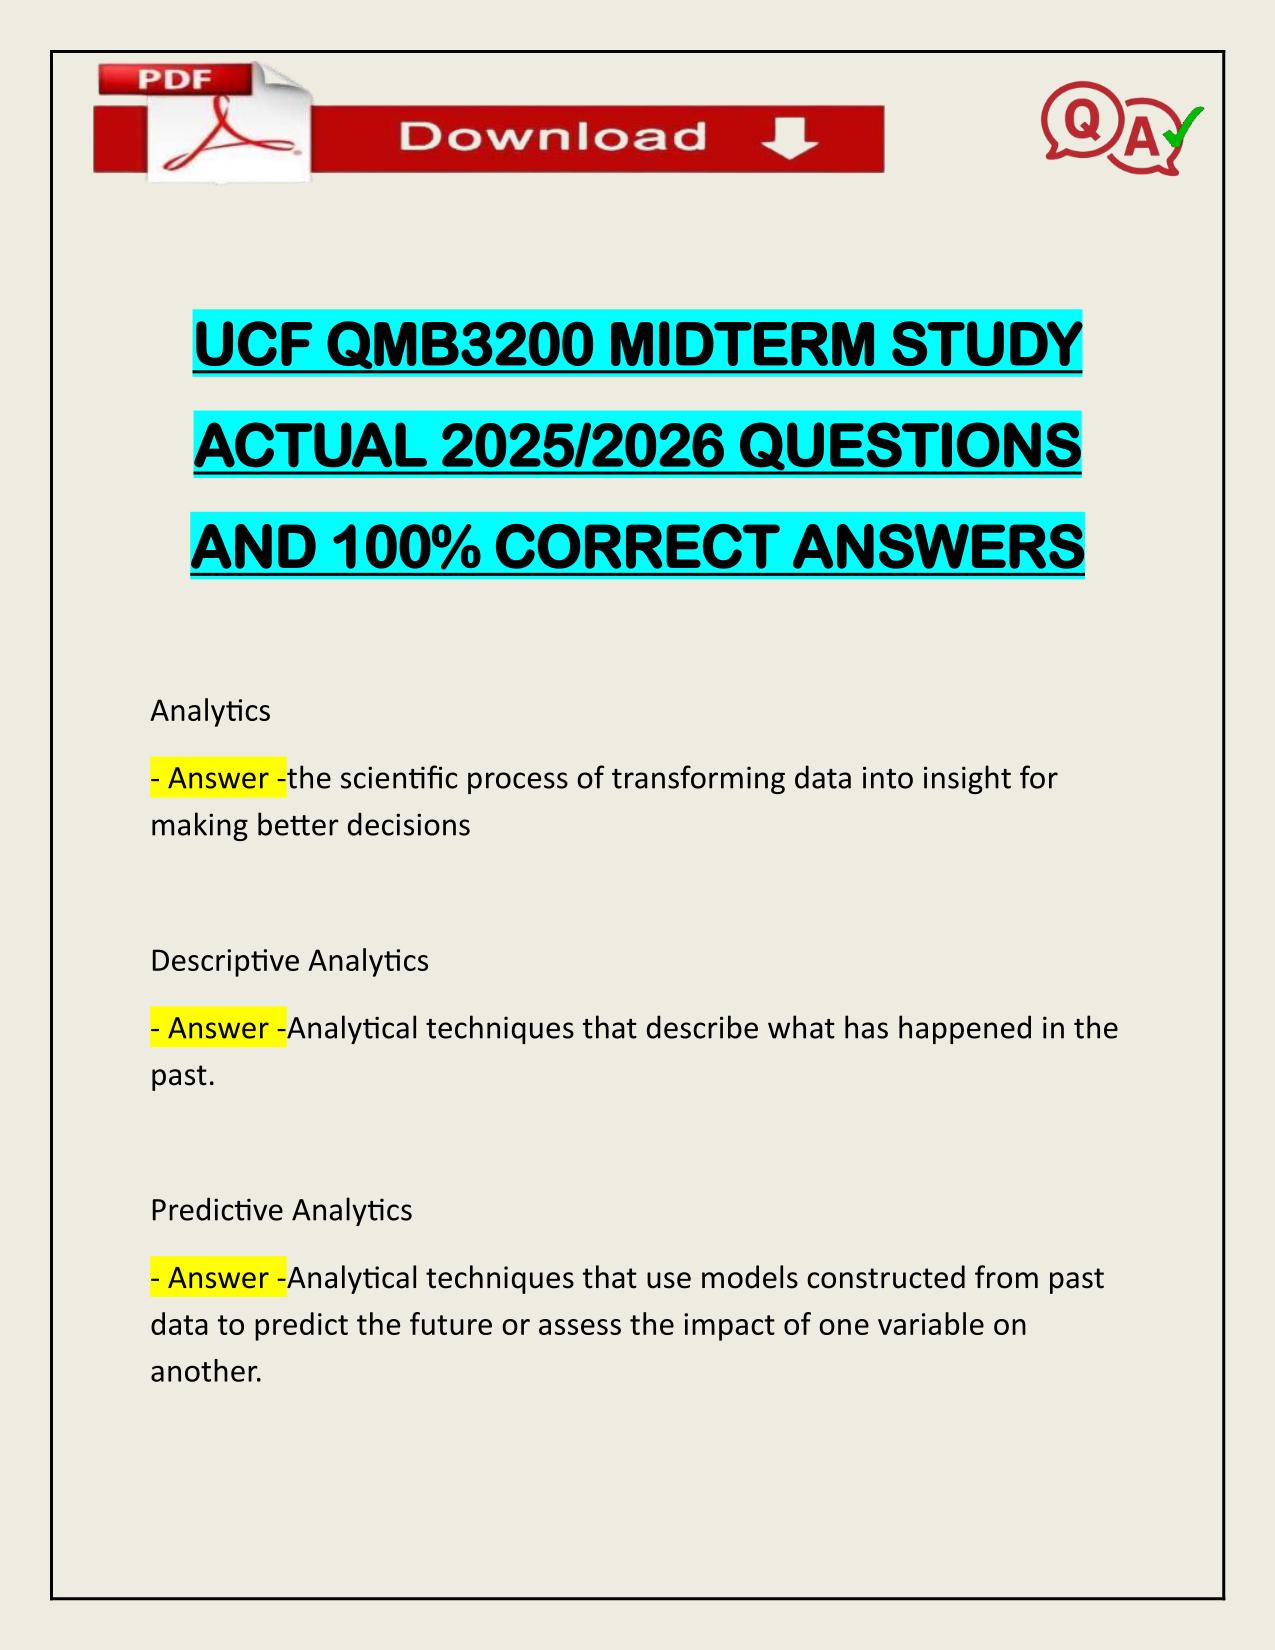
UCF QMB3200 MIDTERM STUDY ACTUAL 2025/2026 QUESTIONS AND 100% CORRECT ANSWERS Analytics - Answer -the scientific process of transforming data into insight for making better decisions Descriptive Analytics - Answer -Analytical techniques that describe...
After purchase, you get:
✅ Instant PDF Download
✅ Verified answer explanations
✅ Refund if not Satisfied
✅ Prepared for 2025/2026 test cycle
Document Information
| Uploaded on: | October 31, 2025 |
| Last updated: | October 31, 2025 |
| Number of pages: | 22 |
| Written in: | 2025/2026 |
| Type: | Exam (elaborations) |
| Contains: | Questions & Answers |
| Tags: | UCF QMB3200 MIDTERM STUDY ACTUAL 2025/2026 QUESTIONS AND 100% CORRECT ANSWERS Analytics - Answer -the scientific process of transforming data into insight for making better decisions Descriptive Analytics - Answer -Analytical techniques that describe what has happened in the past. Predictive Analytics |
Seller Information

AdelineJean
User Reviews (0)
Exam (Elaborations)
$10.00
Bundle Deal! Get all 2 docs for just $14.00
Add to Cart
100% satisfaction guarantee
Refund Upon dissatisfaction
Immediately available after purchase
Available in Both online and PDF
$10.00
| 0 sold
Discover More resources
Available in a Bundle
Content Preview
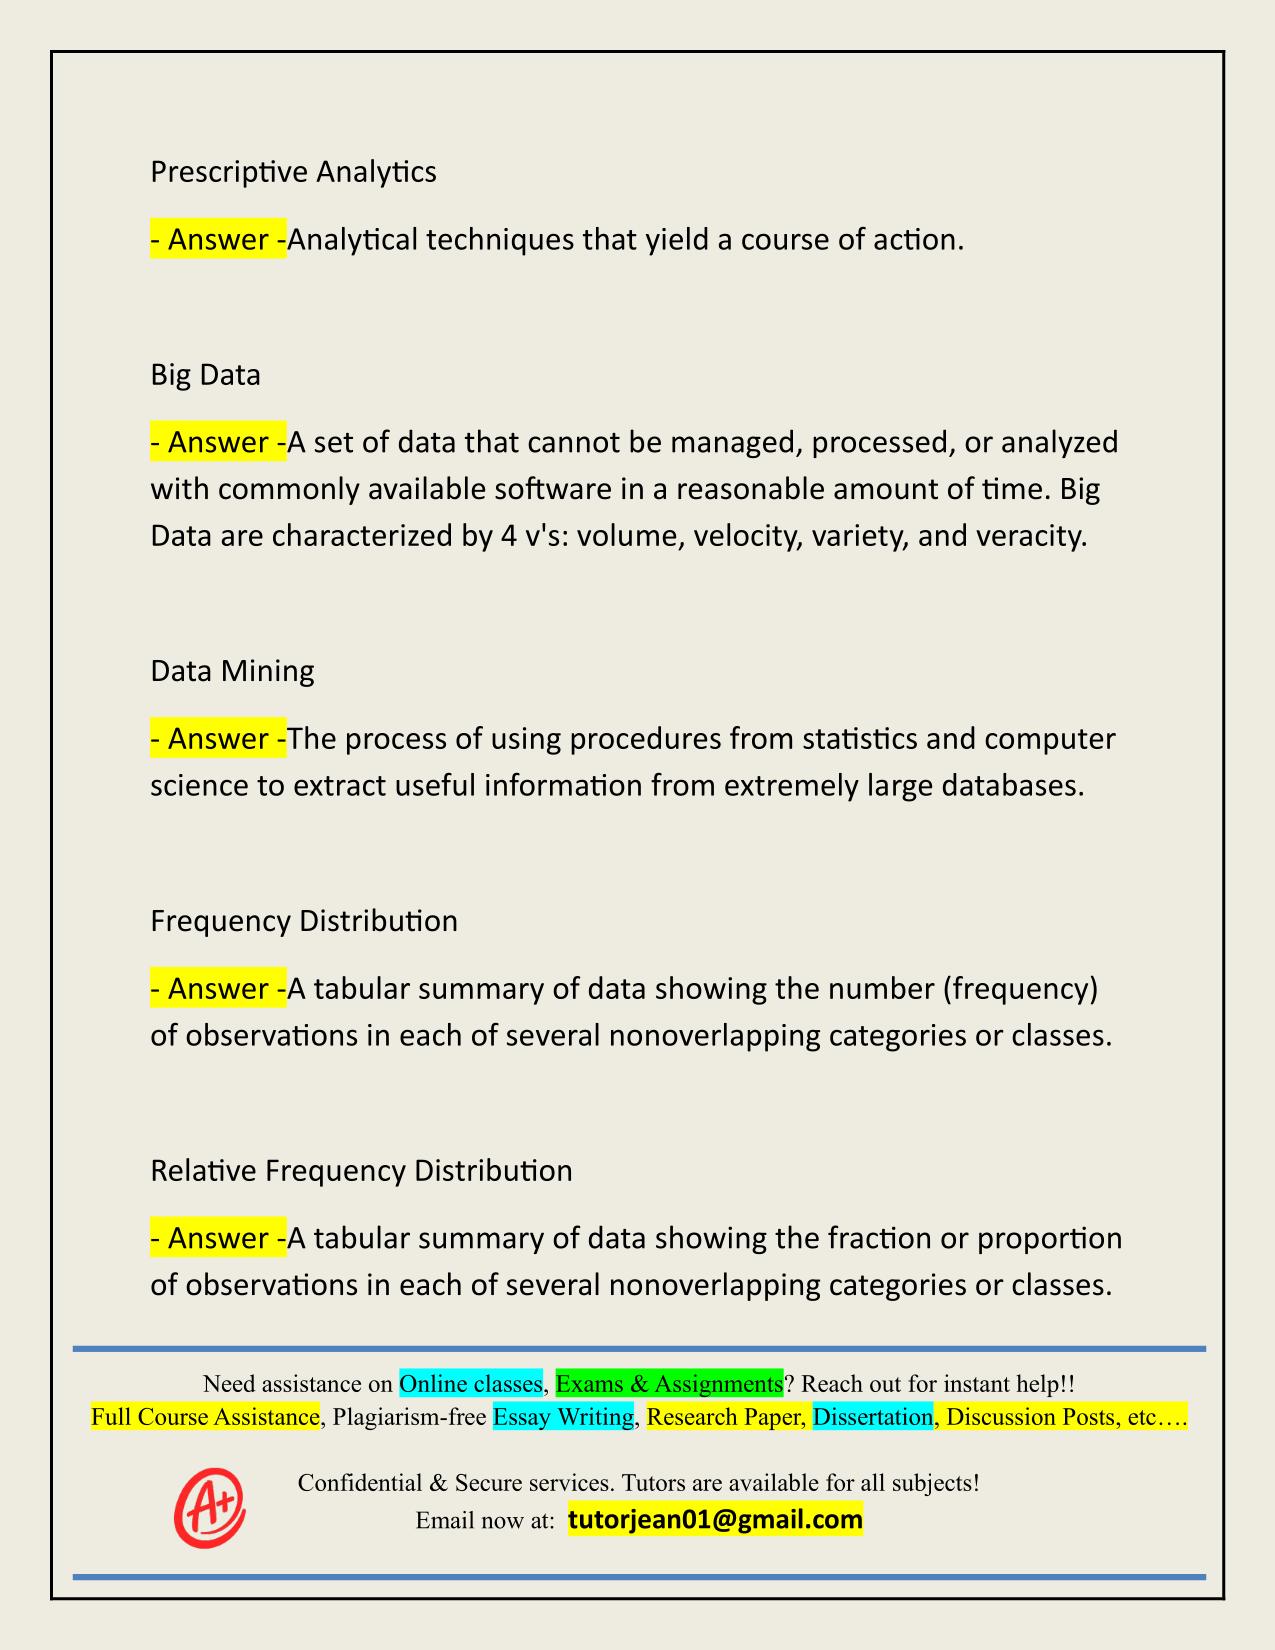
UCF QMB3200 MIDTERM STUDY ACTUAL 2025/2026 QUESTIONS AND 100% CORRECT ANSWERS Analytics - Answer -the scientific process of transforming data into insight for making better decisions Descriptive Analytics - Answer -Analytical techniques that describe what has happened in the past. Predictive Analytics - Answer -Analytical techniques that use models constructed from past data to predict the future or assess the impact of one variable on another. Prescriptive Analytics - Answer -Analytical techniques that yield a course of action. Big Data - Answer -A set of data that cannot be managed, processed, or analyzed with commonly available software in a reasonable amount of time. Big Data are characterized by 4 v's: volume, velocity, variety, and veracity. Data Mining - Answer -The process of using procedures from statistics and computer science to extract useful information from extremely large databases. Frequency Distribution - Answer -A tabular summary of data showing the number (frequency) of observations in each of several nonoverlapping categories or classes. Relative Frequency Distribution - Answer -A tabular summary of data showing the fraction or proportion of observations in each of several nonoverlapping categories or classes. Need assistance on Online classes, Exams & Assignments? Reach out for instant help!! Full Course Assistance, Plagiarism-free Essay Writing, Research Paper, Dissertation, Discussion Posts, etc…. Confidential & Secure services. Tutors are available for all subjects! Email now at: tutorjean01@gmail.com Percent Frequency Distribution - Answer -A tabular summary of data showing the percentage of observations in each of several nonoverlapping classes. Bar Chart - Answer -A graphical device for depicting categorical data that have been summarized in a frequency, relative frequency, or percent frequency distribution. Pie Chart - Answer -A graphical device for presenting data summaries based on subdivision of a circle into sectors that correspond to the relative frequency for each class. Class Midpoint - Answer -the value halfway between the lower and upper class limits Dot Plot - Answer -a graphical device that summarizes data by the number of dots above each data value on the horizontal axis Histogram - Answer -A graphical display of a frequency distribution, relative frequency distribution, or percent frequency distribution of quantitative data constructed by placing the class intervals on the horizontal axis and the frequencies, relative frequencies, or percent frequencies on the vertical axis. Cumulative Frequency Distribution - Answer -A tabular summary of quantitative data showing the number of data values that are less than or equal to the upper class limit of each class. Cumulative Relative Frequency Distribution - Answer -A tabular summary of quantitative data showing the fraction or proportion of data values that are less than or equal to the upper class limit of each class. Cumulative Percent Frequency Distribution - Answer -A tabular summary of quantitative data showing the percentage of data values that are less than or equal to the upper class Need assistance on Online classes, Exams & Assignments? Reach out for instant help!! Full Course Assistance, Plagiarism-free Essay Writing, Research Paper, Dissertation, Discussion Posts, etc…. Confidential & Secure services. Tutors are available for all subjects! Email now at: tutorjean01@gmail.com


